Slang Netlist is a library and set of tools, built on top of slang, for analysing the static connectivity of a SystemVerilog design. It reads the RTL and builds a graph of its bit-level data dependencies, without any synthesis, so that questions like “what drives this bit?” or “is there a path between these two points?” can be answered directly from the source. It is the successor to Netlist Paths, which extracted a similar graph from Verilator but could only work with whole variables rather than bits.
I presented the tool at ORConf 2026 (slides here) and covered how it behaves on real designs: whether it produces useful results, and how its runtime and memory scale. This note proivides the full detail on these results.
Finding undriven inputs
A simple but useful analysis is to find instance input ports, or individual bits of them, that have no driver. This is a symptom of a missing connection or a wire that was declared but never assigned, and it is easy to introduce in a large design with many levels of hierarchy. Lint tools will flag a port left explicitly unconnected, or a signal that is never assigned, but they report these locally and per signal. They don’t directly tell you which bits of which instance ports end up without a driver once connections are followed through the hierarchy.
In the netlist graph, each port slice is a node and the drivers of that slice
are its predecessors, so the check is a single pass over the graph that tests
each input port node with Port.is_driven(). Wide ports that are only partly
connected are split into several slice nodes, so partially driven ports fall
out of the same check by reading the bit range of each undriven slice. Inputs
of the top-level module are the sources of the graph and are skipped. The core
of the check is:
def find_undriven_bit_ranges(graph, top_module):
    prefix = top_module + "."
    by_path = {}
    for node in graph:
        if node.kind != pyslang_netlist.NodeKind.Port or not node.is_input():
            continue
        if node.path.startswith(prefix) and "." not in node.path[len(prefix):]:
            continue
        if node.is_driven():
            continue
        lo, hi = node.bounds
        by_path.setdefault(node.path, []).append((lo, hi))
    return by_path
The full script, which also merges adjacent undriven ranges, is in the
repository as
examples/unconnected_inputs.py.
I ran it on two open-source RISC-V cores, taken as they come from the RTLMeter
suite used for the benchmarks below, in both cases with a single thread. The
runtimes are for building the graph end-to-end, including parsing and
elaboration; the check itself is a single pass over the graph:
| Design | Graph size | Runtime | Undriven inputs |
|---|---|---|---|
| XuanTie C906 | 197 k nodes | 0.8 s | None |
| VeeR EL2 (default configuration) | 70 k nodes | 0.5 s | 569 ports, 1,124 bits |
The C906 is clean. The VeeR EL2 findings are all real undriven connections
rather than false positives, and fall into two groups. The large majority, 543
ports, are gated-clock inputs left dangling because the clock gating cells are
only instantiated under an ifdef that isn’t set in this configuration. The
remaining 26 are mostly AXI response signals on the core’s bus interfaces, which
are connected to wires in the testbench wrapper that are declared and read but
never assigned. Neither is a bug in the core itself, but they are exactly the
kind of thing that is worth knowing about, and it took less than a second to
find them.
Benchmarks
Methodology
I used the designs from RTLMeter, a suite of open-source designs collected for benchmarking Verilator, which has the advantage of providing a ready-made set of file lists and build configurations for a range of design sizes. Of these, 13 designs build cleanly with Slang Netlist; BlackParrot and Caliptra are excluded because they don’t currently elaborate with slang. Several of them have multiple configurations (for example, OpenPiton with 1x1, 2x2, 4x4 and 8x8 grids of tiles, and Vortex in mini, sane and huge sizes), giving 27 configurations in total. The smallest, the SERV bit-serial RISC-V core, produces a graph of 1.5 k nodes, and the largest, OpenPiton 8x8, produces 43.3 M nodes. In between are NVDLA, OpenTitan, the VeeR EH1, EH2 and EL2 cores, the XiangShan processor and the XuanTie C906, C910, E902 and E906 cores.
Each configuration was run with the slang-netlist command-line tool at 1, 2, 4
and 8 threads, with a single run per point. The host was a dual-socket AMD EPYC
9374F server (64 cores, no SMT) with 2.2 TB of memory, running Rocky Linux 8.10,
so neither cores nor memory were a constraint. The binary was built with Clang
21.1 from slang-netlist 0.11.0 against slang 6001e362f. The --stats-json
option reports the wall-clock time spent in each phase (parsing, elaboration,
slang’s analysis passes, and netlist construction, which is itself broken down
into its sub-phases), together with the peak resident set size of the process
and the number of nodes and edges in the graph. The benchmark scripts, which
drive the sweeps, merge the results into a CSV with power-law fits and produce
the charts below, are on the
benchmark-scripts
branch of the repository.
Two details of the benchmark setup are worth noting. The first is that the
slang-netlist binary is a release build with the Python bindings disabled.
Enabling the bindings drops slang’s
mimalloc integration, and on this
allocation-heavy workload that costs about 30% in runtime. The second is memory:
OpenPiton 8x8 needs more than 30 GiB, and so a sufficiently-sized host is
required to prevent swapping. The complete sweep takes a couple of hours,
dominated by the largest configurations.
Runtime
Runtime is close to linear in the size of the graph across four orders of magnitude: a power-law fit gives an exponent of 0.91 at 1 thread and 0.85 at 8 threads, the slightly sub-linear figure reflecting the fixed start-up cost that dominates the smallest designs. That is what you would hope for from a process that is essentially a collection of per-block analyses followed by a merge. The largest design, OpenPiton 8x8, with 43.3 M nodes and 48.9 M edges, builds in 63 s with eight threads, and 240 s with one. At the other end, SERV takes about 10 ms.
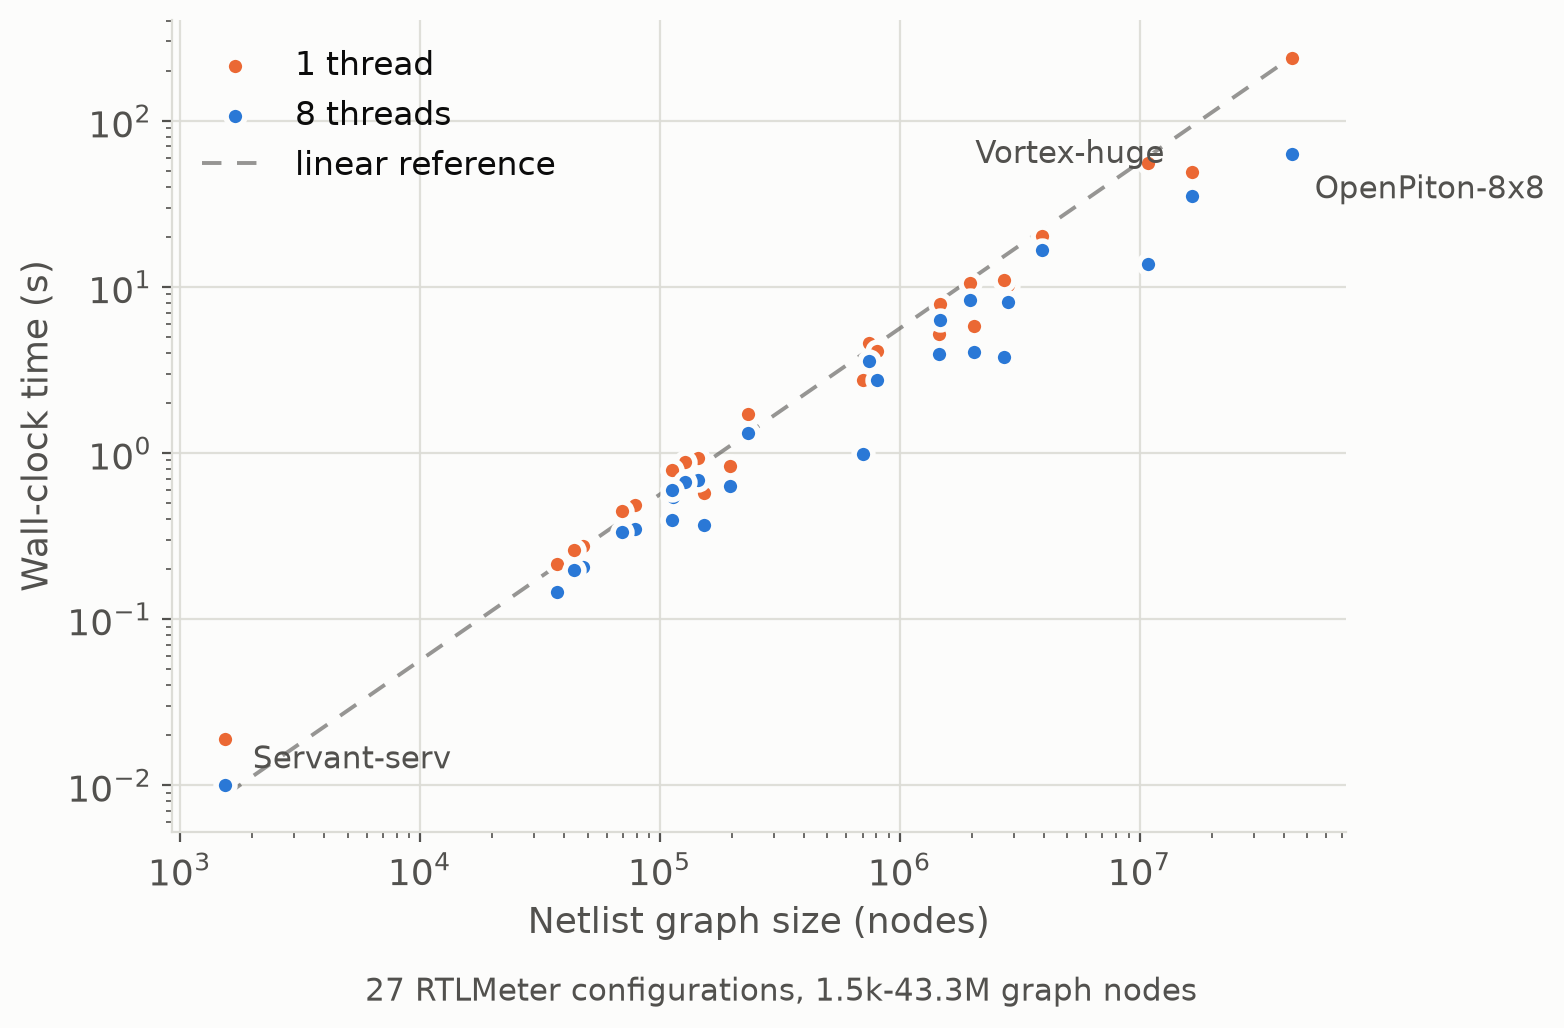
The vertical spread between the 1- and 8-thread points is the parallel speedup. It is visibly larger for some designs than others, which the thread scaling results below account for.
Memory
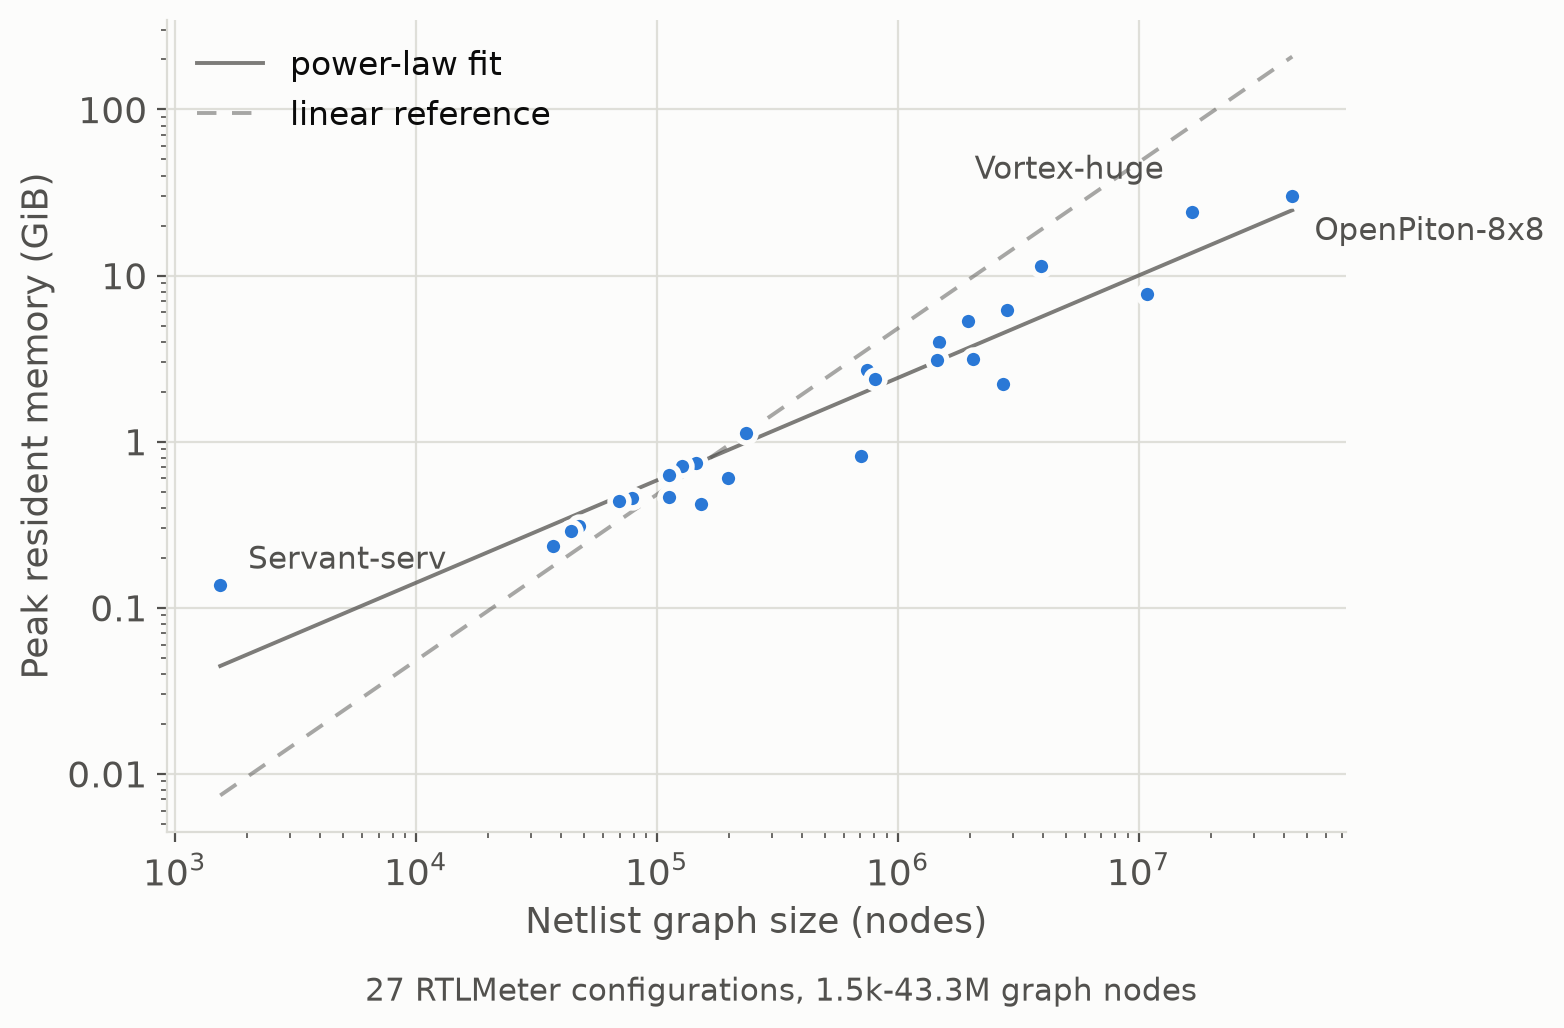
Peak resident memory at 8 threads scales sub-linearly with graph size, with a fitted exponent of 0.62, so the memory cost per node falls as designs get larger. The median design uses around 3.2 KiB per graph node, but OpenPiton 8x8 uses only about 750 bytes per node, at 30 GiB in total. At the other extreme, SERV’s 1.5 k nodes sit on a fixed floor of about 140 MB, which is the cost of the process and slang’s own data structures before any graph is built. The most likely explanation for the trend is that a substantial fraction of the memory is not the graph itself but slang’s AST and analysis data, and OpenPiton’s tile-based structure means a large graph is built from a comparatively small amount of elaborated source.
Where the time goes
Breaking the runtime of the six largest configurations down by phase, at 8 threads, shows that elaboration is significant throughout: it takes around 30% for most designs, and for Vortex-huge it takes just over half, more than netlist construction. In every other case netlist construction takes the largest share. Parsing and slang’s analysis passes are small by comparison, with XiangShan the exception on parsing, which I put down to its Chisel-generated source being a few very large files.
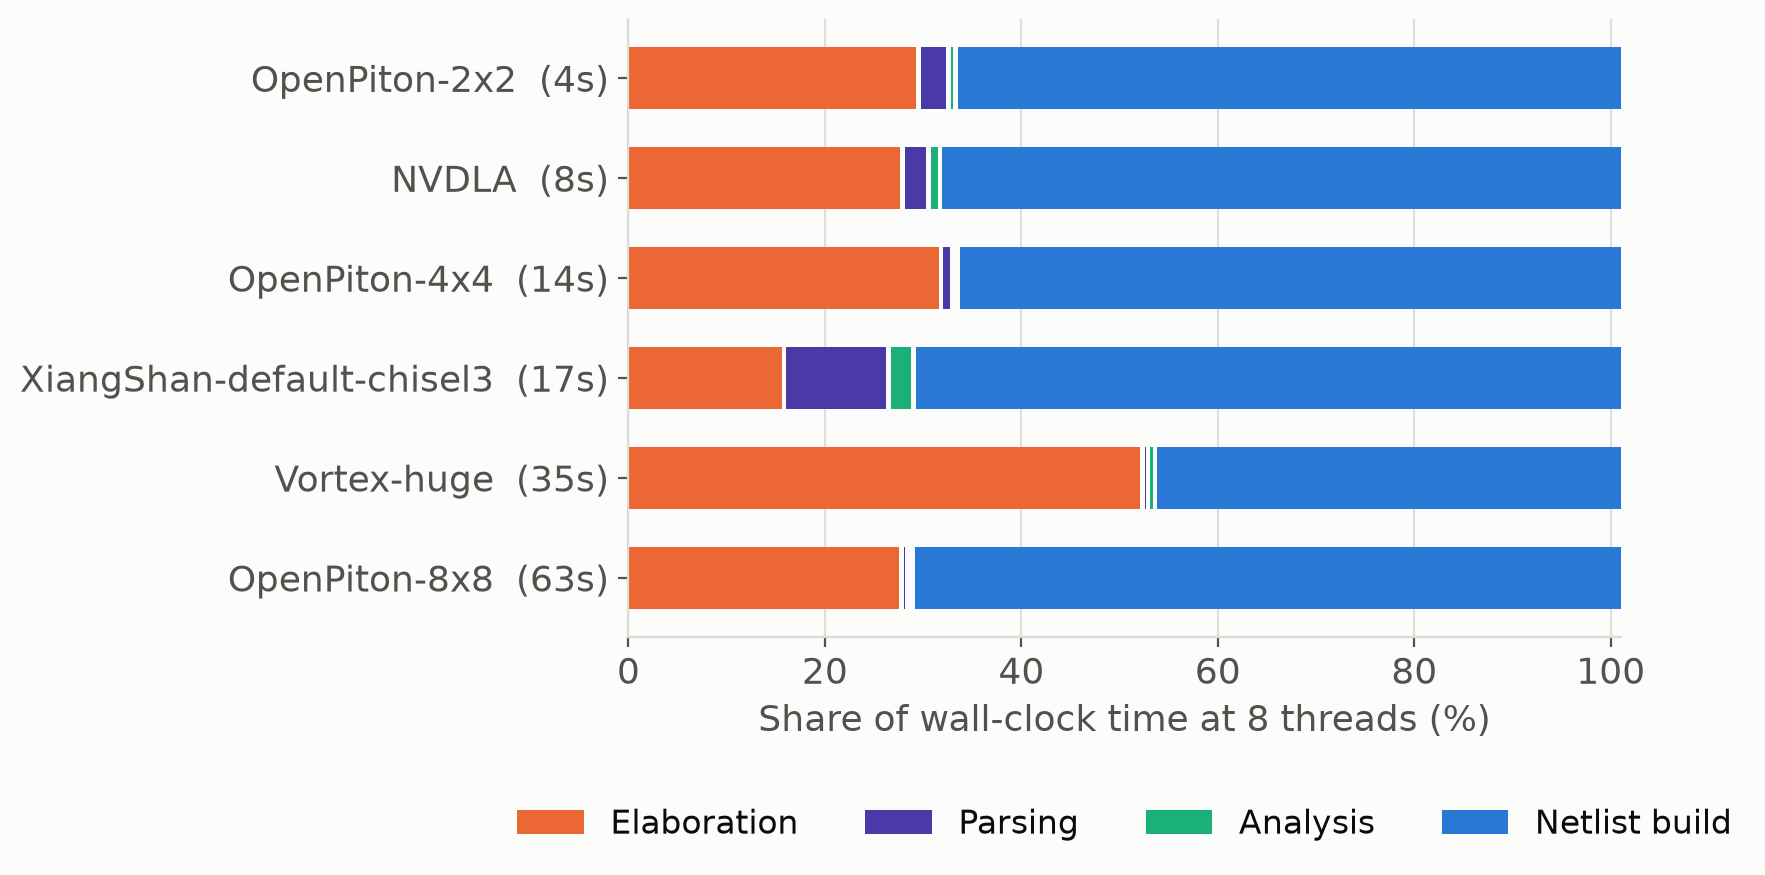
The significance of elaboration is that it is single-threaded in slang, so it doesn’t benefit from additional cores: its median speedup across the suite with 8 threads is 1.00×. By Amdahl’s law, that puts a ceiling on the overall speedup regardless of how well netlist construction parallelises: with elaboration already around 30% of the remaining time at 8 threads, even unlimited threads could make these designs at most about 3.3× faster than they are now. It is also why the end-to-end speedups are well below those of netlist construction taken on its own: OpenPiton 8x8 gets 3.8× overall against 4.9× for netlist construction alone.
Thread scaling
Netlist construction has four sub-phases: collecting the blocks, a parallel data-flow analysis that runs independently on each procedural block and continuous assignment, and then serial phases that merge the results and resolve R-values. OpenPiton scales well, at 5.5× for the 4x4 grid and 4.9× for 8x8, and the data-flow analysis on its own reaches 6.2× on the 4x4 grid, the best in the suite. The scaling is not just a matter of size: the 1x1 configuration, with 700 k nodes, still manages 3.8×, so it is presumably something about the structure of OpenPiton’s blocks, which are similarly sized and numerous enough to keep all the threads busy.
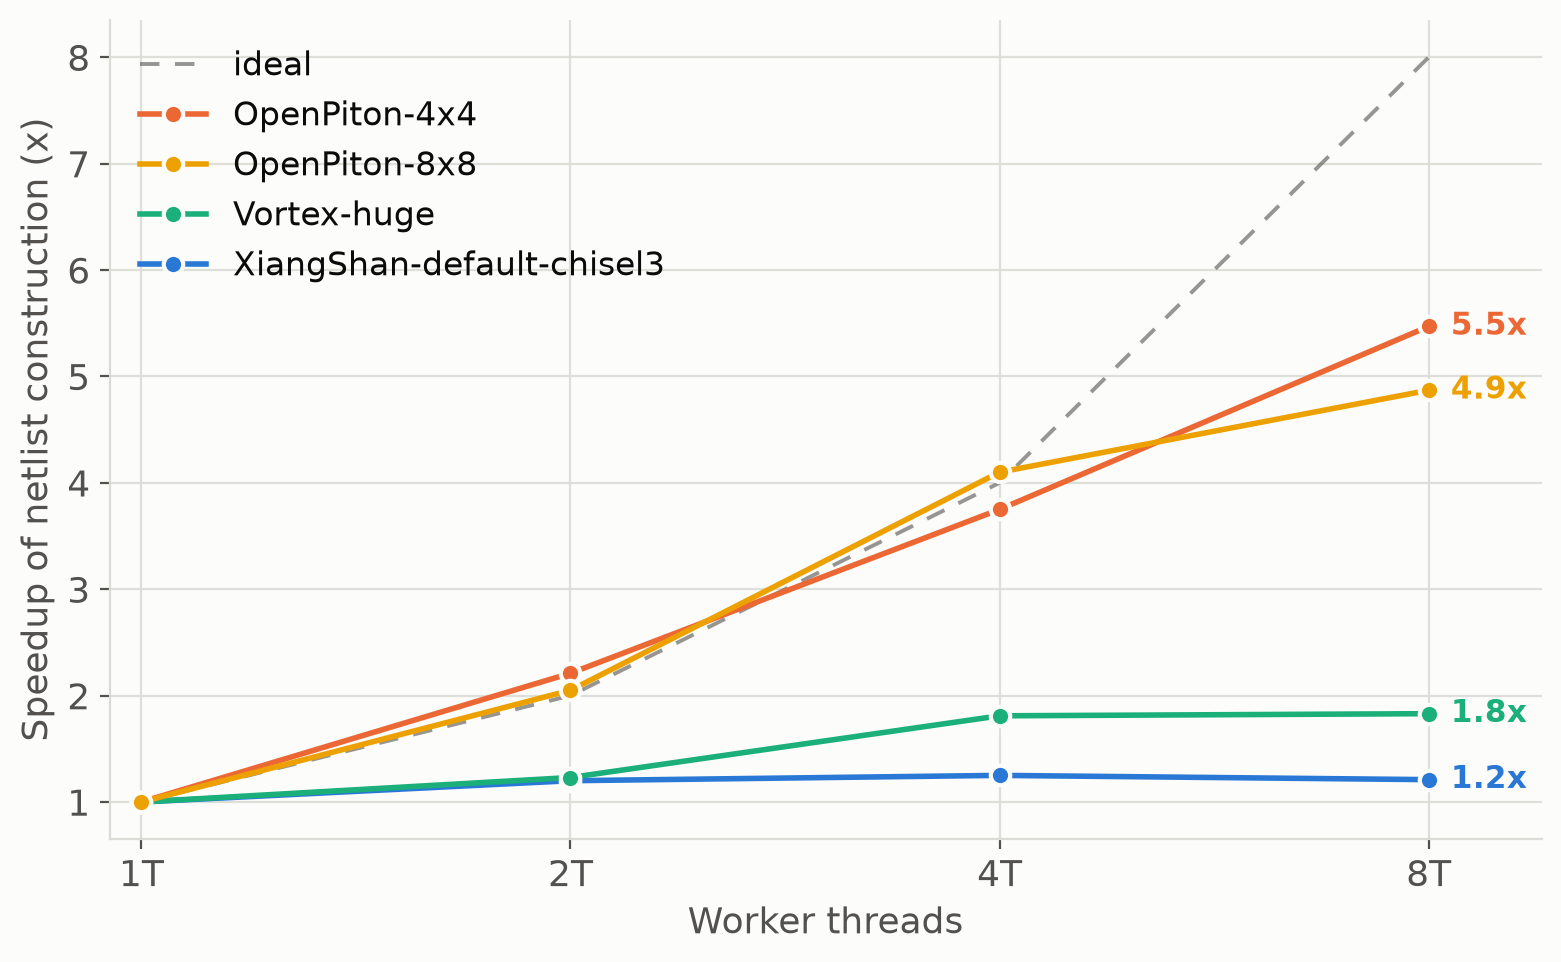
Vortex-huge and XiangShan tell a different story, flattening out at 1.8× and
1.2× respectively: Vortex-huge gains nothing beyond 4 threads and XiangShan
nothing beyond 2. On XiangShan the data-flow analysis itself speeds up by only
1.06×, despite the design having 1.7 M blocks to distribute, which suggests
that a handful of very large blocks dominate the work: XiangShan, being
generated from Chisel, has enormous always blocks, and the parallel phase can
be no faster than its longest one. The serial merge and resolution phases then
take a fixed share of what remains.
The mean netlist construction speedup across the whole suite is 1.9×, but the median is only 1.5×. Every design under a million nodes, other than OpenPiton 1x1, lands between 1.3× and 1.7×, so the mean is pulled up by the OpenPiton configurations, and for a typical design threading is worth less than a doubling. For the smaller designs, the whole build takes well under a second, and the serial phases and the cost of starting threads take a larger share. Improving this would mean either splitting the analysis of large blocks or parallelising the later phases, and it is the most obvious direction for further performance work.
Conclusions
Taking these results together: Slang Netlist handles all 27 configurations of the 13 RTLMeter designs that build cleanly, its runtime is close to linear in graph size, and even the largest open-source designs I could find build in about a minute on a host with enough memory. That is fast enough to run a check like the undriven-inputs analysis above as part of a routine flow. The main limitations are memory on the largest designs and the parallel scaling of designs with a few very large blocks; elaboration is a fixed cost from slang.