Two years ago I reviewed a year’s worth of data from my Vaillant aroTHERM plus heat pump and the results were positive: a seasonal coefficient of performance (SCOP) of 3.41 and a house held at 19 degrees C all year. I also noted that the planned renovation work offered further efficiency gains.
Building work started in December 2024 and the heat pump was decommissioned in February 2025 when the central heating system was drained and recommissioned in July 2025. During the work, the ground-floor living area was extended, the entire ground floor slab was replaced and upgraded with 100 mm of foam insulation, underfloor heating was installed throughout, allowing all ground-floor radiators to be removed. An additional bedroom was added upstairs with a new radiator.
Underfloor heating has an enormous emitter area, so in principle it can deliver the same heat as conventional radiators at a lower flow temperature, thereby improving system efficiency. I expected an improvement, but the efficiency dropped. This note is about the changes observed in the data logged by the Vaillant gateway.
Picking a comparison
I now have four years of logged data but 2025 is the renovation year and is unusable as a comparison. The data shows the house going cold: the system ran normally until 10 February, then the hot water tank falls from 45 degrees C to 10 over about ten days and the room temperature follows it down to a low of 4.3 degrees C. On 11 March the gateway stops logging altogether and there is nothing until 16 July, a gap of 126 days.
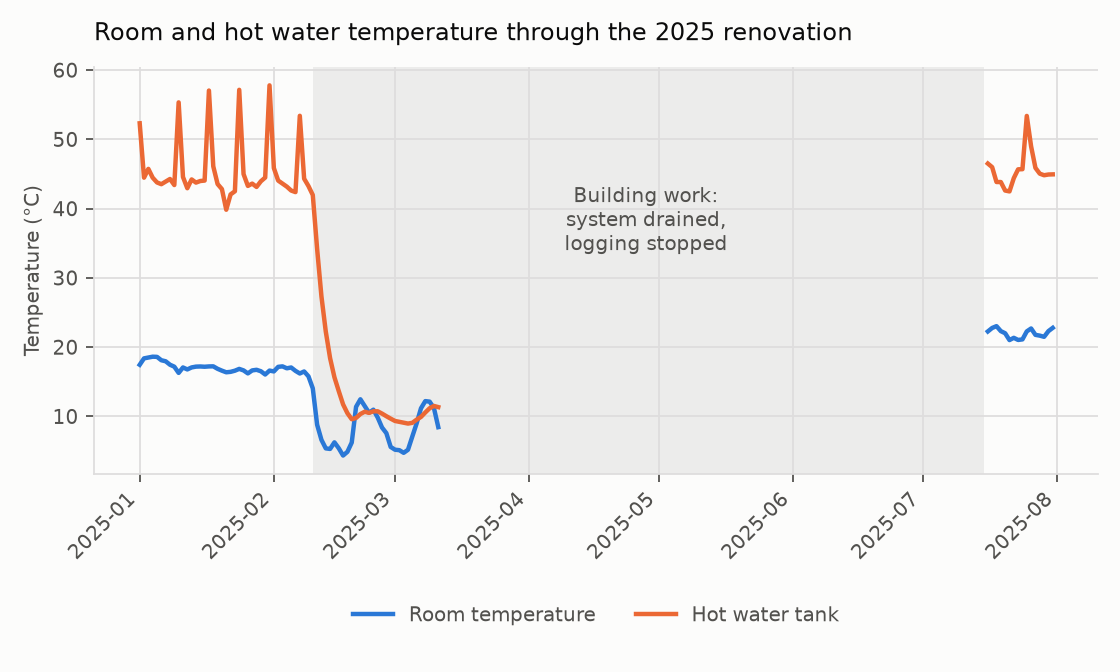
That leaves 2024 as the last full heating season before the work and 2026 as the first full one after it. The comparison throughout this note is therefore 1 January to 30 April, in 2024 against 2026. Both are complete, with 121 and 120 logged days respectively, and they were almost identically cold: 715 heating degree days against 729, and a mean outdoor temperature of 9.6 degrees C against 9.5.
I have limited this to the heating season because summer COP figures are dominated by cycling and standby losses on days when the heat pump has minimal heat demand, and the kWh quantisation in the Vaillant export makes them very noisy. The heating season is both the part that matters for energy use and the part where the measurement is meaningful.
The caveats from the previous note still apply: the Protons for Breakfast review of the myVaillant app measured roughly an 8% error in electricity consumed and 20% in heat generated, and many logged values are quantised to whole kWh, which means the raw data under-reports COP. Since I am comparing Vaillant’s data against itself here, those errors should largely cancel, which is one advantage of a before-and-after.
The headline figures
| 1 January – 30 April | 2024 | 2026 |
|---|---|---|
| Days logged | 121 | 120 |
| Consumed electricity heating | 772 kWh | 1,050 kWh |
| Consumed electricity hot water | 469 kWh | 335 kWh |
| Heat generated heating | 2,888 kWh | 3,529 kWh |
| Heat generated hot water | 1,363 kWh | 979 kWh |
| Heating SCOP | 3.74 | 3.36 |
| Hot water SCOP | 2.91 | 2.92 |
| Total SCOP | 3.43 | 3.25 |
| Heating degree days | 715 | 729 |
| Mean outdoor temperature | 9.6 °C | 9.5 °C |
| Mean room temperature | 18.7 °C | 19.9 °C |
Heating SCOP is down from 3.74 to 3.36, a drop of about 10%, between two seasons with essentially the same weather. Hot water SCOP is unchanged at 2.91 against 2.92.
Hot water consumption fell sharply, from 469 to 335 kWh, but that reflects how much hot water we use, not how efficiently it is made.
Hot water as a control
The hot water result is consistent over both periods and so provides a useful control.
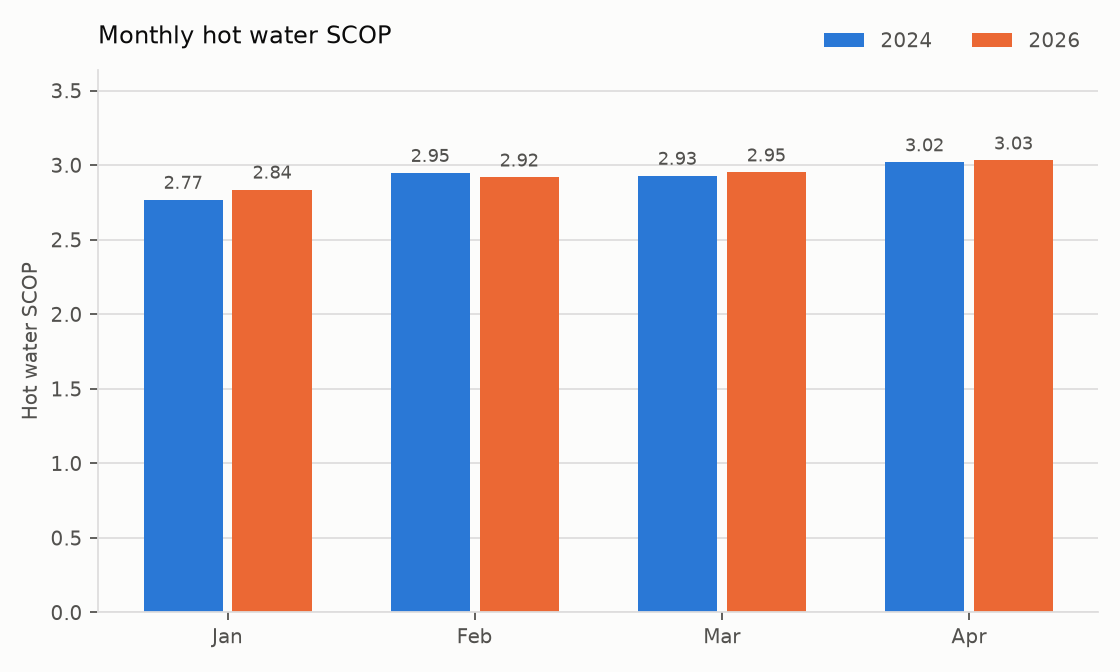
Month by month the hot water circuit performs almost identically in the two years: 2.77 against 2.84 in January, then 2.95/2.92, 2.93/2.95 and 3.02/3.03. The cylinder, its connection to the heat pump and the way it is run were untouched by the building work, and the data reflects this. Whatever happened to the space heating did not happen to the heat pump as a unit.
The house needs more heat
The house is bigger than it was, so some increase in heat demand is expected. Plotting daily heat generated against outdoor temperature shows how much.
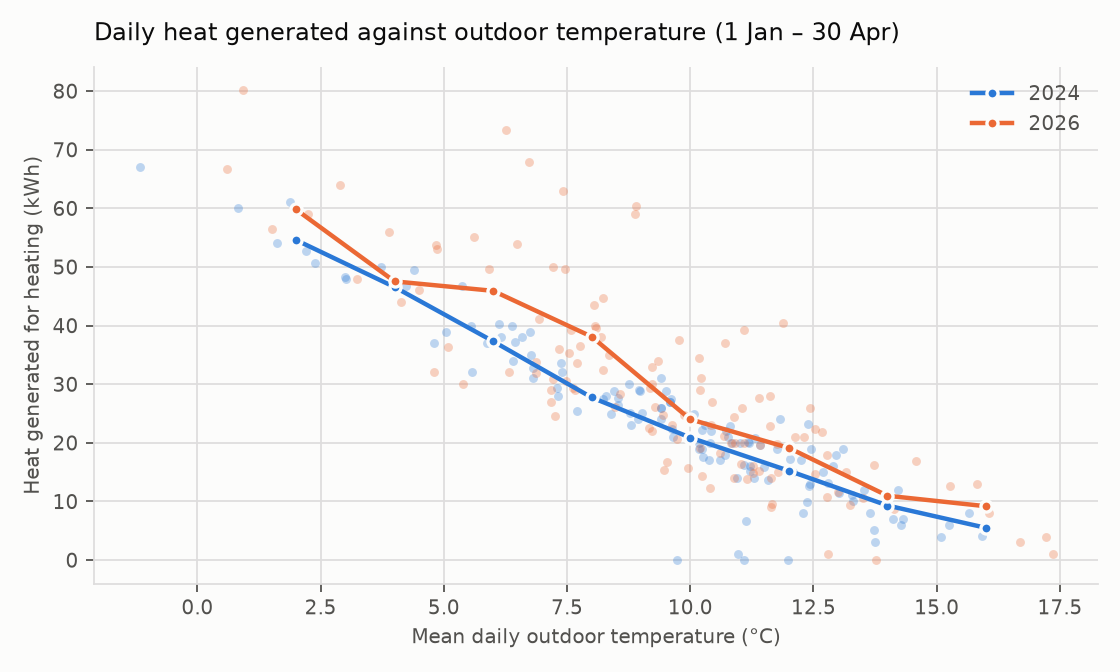
The 2026 curve sits consistently above the 2024 one. Normalised against heating degree days, demand rose about 20%, from 4.04 to 4.84 kWh per degree day. Two things drive that: the extension added heated floor area, and the house is now held about 1.1 degrees C warmer through the heating season, 19.9 against 18.7.
Floor area and room temperature affect efficiency differently. A bigger space at the same temperature needs more heat but shouldn’t lower efficiency. Holding it warmer might. Needing more electricity per unit of heat is the part I didn’t expect.
The efficiency gap grows with the cold
Here is daily heating COP against outdoor temperature, using only days with more than 3 kWh of electricity for heating:
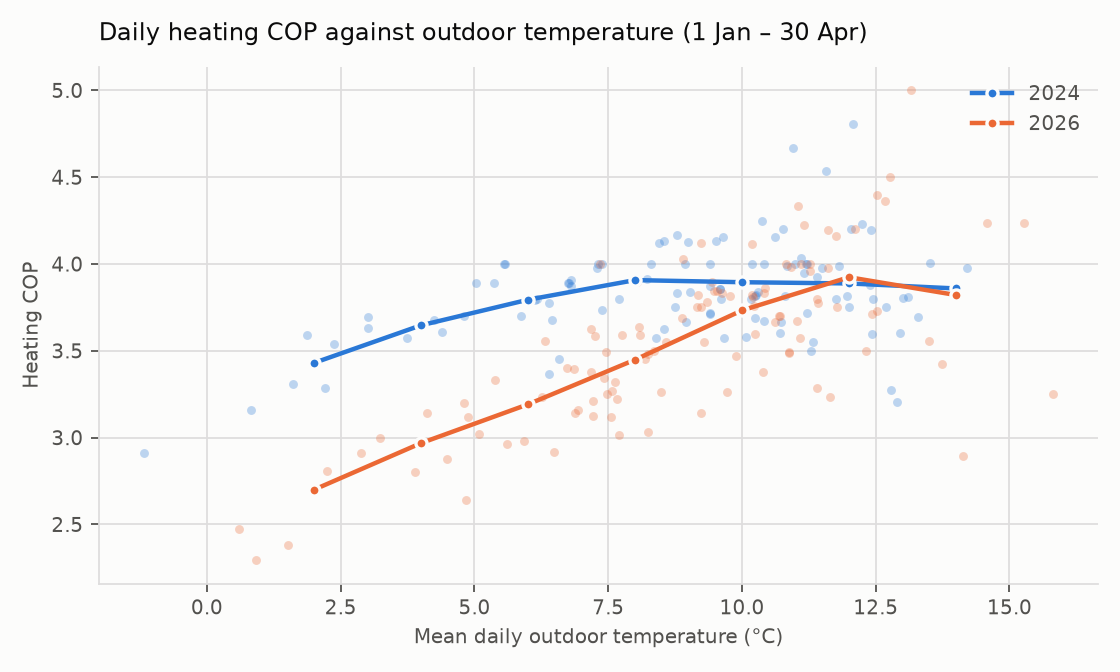
The two curves are indistinguishable in mild weather and separate steadily as it gets colder:
| Outdoor temperature | 2024 COP | 2026 COP | Difference |
|---|---|---|---|
| 12 °C | 3.89 | 3.92 | +0.04 |
| 10 °C | 3.89 | 3.73 | −0.16 |
| 8 °C | 3.91 | 3.45 | −0.46 |
| 6 °C | 3.79 | 3.19 | −0.60 |
| 4 °C | 3.65 | 2.97 | −0.68 |
| 2 °C | 3.43 | 2.70 | −0.73 |
At 12 degrees C the two years are the same to within noise. At 2 degrees C the new one is 0.73 of a point worse, more than 20% lower. The cold end is what dominates winter energy use, so this is not a small effect.
The same pattern appears in the monthly figures:
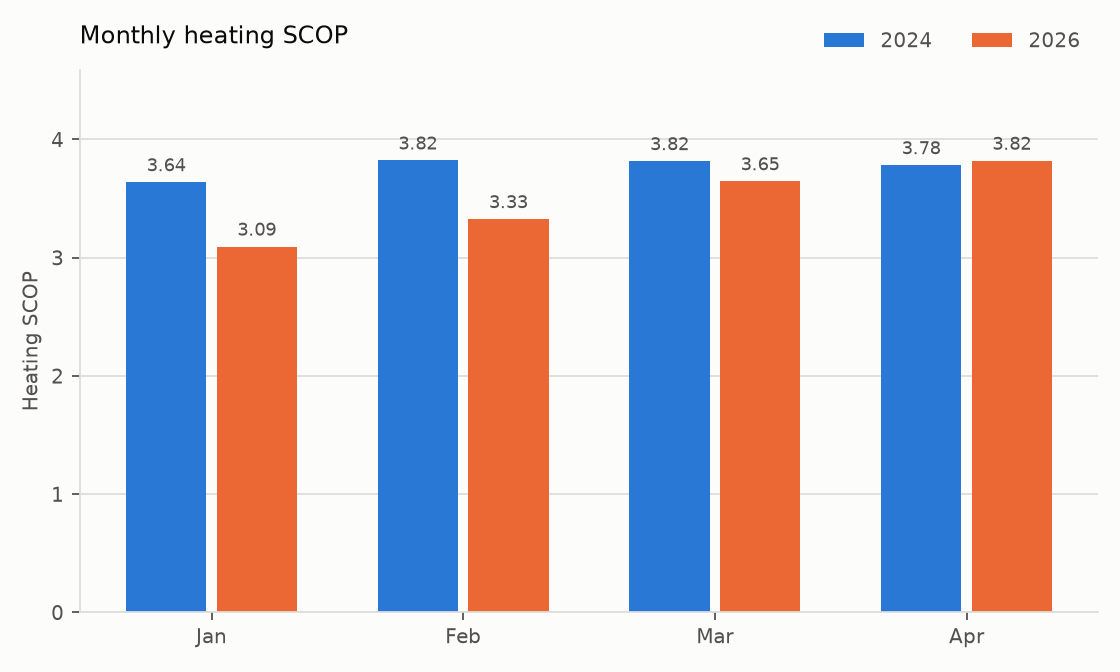
January is 3.64 against 3.09, a drop of 15%, and February 3.82 against 3.33, a drop of 13%. By March the gap has shrunk to 3.82 against 3.65, and by April it has gone entirely, 3.78 against 3.82.
What it is not
I don’t know the cause of the drop in efficiency, but the data rules out several things:
-
It is not the heat pump itself. The same unit, over the same months, produced unchanged hot water performance.
-
It is not that the house is bigger. More floor area explains a larger bill, not a worse ratio of heat out to electricity in, and the hot water circuit shows the unit is still capable of the previous COP.
-
It is not a drift over time that happens to coincide with winter. The deficit tracks outdoor temperature rather than date. It is largest in the coldest weather and absent by April, in both the binned curve and the monthly bars.
Possible causes
Three things could explain it, and the logged data cannot rule any of them out:
-
A warmer house. Holding 19.9 degrees C instead of 18.7 asks more of the heat pump, and a higher flow temperature is what delivers that. A higher flow temperature lowers COP.
-
The new underfloor circuit running at a flow temperature that is higher than it needs to be. Underfloor heating should work at a much lower flow temperature than radiators, and a setting that is too high makes the heat pump work harder for every unit of heat.
-
The screed still drying out. A new underfloor screed absorbs a lot of heat in its first season, and the 2026 figures cover the first heating season since recommissioning. The gap shrinking through the spring fits this, though it fits the weather too.
None of these is proven, and I cannot yet say why the gap would appear only in cold weather, when the two years match at 12 degrees C. The first two ideas are about flow temperature, which is exactly what the logs do not record. The screed is easier to test: the winter of 2026/27 will show whether the gap shrinks in a second season.
The limit is the data. The Vaillant export gives daily energy totals and hourly temperatures, and nothing else. There is no flow or return temperature, no compressor behaviour and no runtime hours. Nothing that would separate the remaining possibilities is logged. An OpenEnergyMonitor install, which I have been meaning to do since the last note, would record flow and return temperatures directly and give me an independent check on Vaillant’s energy figures at the same time. It would also show whether the underfloor flow temperature is too high. That is the next step before I speculate any further.
Summary
A whole-house renovation that added insulation, an extension and underfloor heating throughout the ground floor left my heat pump about 10% less efficient at space heating across a full heating season, and around 15% less efficient in January and February.
The house also needs about 20% more heat per degree day than it did. Both the extra floor area and the higher room temperature contribute. The efficiency drop is specific to space heating, grows with the cold, and has so far been seen in one heating season since the work. I suspect the warmer house or an underfloor flow temperature that is too high, but a screed that is still drying could also play a part, and the logged data does not contain enough to find out.
The annual headline number hides all of this. The pattern only appeared when I plotted COP against outdoor temperature, which holds the weather constant instead of averaging over it. The data from the myVaillant app is somewhat inaccurate and doesn’t record flow temperatures, but is good enough to show that something changed.
The analysis code and the script that produces these charts are on GitHub.